


Is the Product Engagement Score (PES) a useful metric?
The benefits and challenges of using PES as an indicator of product health.

As product metrics go, I believe that retention gives the best signal for product-market fit. But retention alone may not give the full picture. A retention metric is binary; either users were retained or not. As a product manager, you might get lulled to sleep if you just measured retention and didn’t have a pulse on how engaged your users were. And that’s when I stumbled upon a metric called the Product Engagement Score (PES). As far as I can tell, PES was first introduced by Pendo in 2019 and later updated in 2022.
What is PES?
The goal of PES is to ‘give product leaders that single, actionable metric to describe how their product is performing.’
What got me interested in taking a closer look at this metric was that its original configuration of inputs included retention but added feature adoption as a measure of breadth of engagement as well as frequency of usage as a measure of stickiness. The original configuration is below:
Breadth = feature adoption (the percentage of features that generate eighty percent of click volume)
Depth = app retention (the percentage of users retained in the first three months of usage)
Frequency = stickiness (the percentage of users who return daily: e.g. DAU/MAU)
The original calculation for PES was:
[(Feature Adoption + App Retention + Stickiness) / 3] * 100
It must have gone through another iteration some time in between 2019 and 2022 because in the blog post from 2022 they say:
we designed PES as a composite score made up of three individual metrics directly tied to user engagement: adoption, stickiness, and growth.
Retention seems to have been replaced by growth, with the growth metric answering the question “Do you regularly acquire and keep new users?”
The latest configuration of PES is as follows:
The adoption metric answers the question “How widely are your users adopting your product?” and is calculated by:
Average number of core events used by active users
The growth metric answers the question “Do you regularly acquire and keep new users?” and is calculated by:
New + Recovered Users / Dropped Users
The stickiness metric remained the same. It answers the question “How often do users come back to your product?” and is calculated a number of ways depending upon the expected frequency of usage of the product. For example, if you use DAU/WAU as your stickiness metric, you will count how many users logged into your app on a given day and divide by the number of unique users who logged in during the previous 7 days.
So the new calculation for PES is:
PES = (Adoption rate + Stickiness rate + Growth rate) / 3
The PES can range from 0 to 100, where higher scores indicate higher engagement.
For example, let’s say your product has an adoption rate of 80%, a stickiness rate of 30%, and a growth rate of 10%. Then, your PES would be:
PES = (80 + 30 + 10) / 3 PES = 40
This means your product has a moderate level of engagement, but there is room for improvement.
Analysis
Now what I want to do is use PES with some data and see if it is a useful way to assess if our product is on the right track. I have manipulated a couple of the components of this equation in a certain direction to see if the PES still provides a clear signal of product health.
Let’s assume we have an AI photo editing product with 4 core events. We have 10,000 users. We have some data for the last 12 weeks. There was 1 new core event added during this period.
Here’s what our PES looks like over the past 12 weeks.

Here’s what our adoption looks like over the past 12 weeks as measured the average number of core events used by active users:

Besides a dip in week 9 (which is when a new core event was added), we have a decent looking uptrend. It looks like our users are increasingly adopting our core features. It also looks highly correlated with our PES score.
How does growth look like over this time?

Houston, we have a problem. Given that the formula for growth is New + Recovered Users / Dropped Users, the problem could be from a decrease in new users or recovered users or an increase in dropped users, or both. Let’s dig a little deeper.
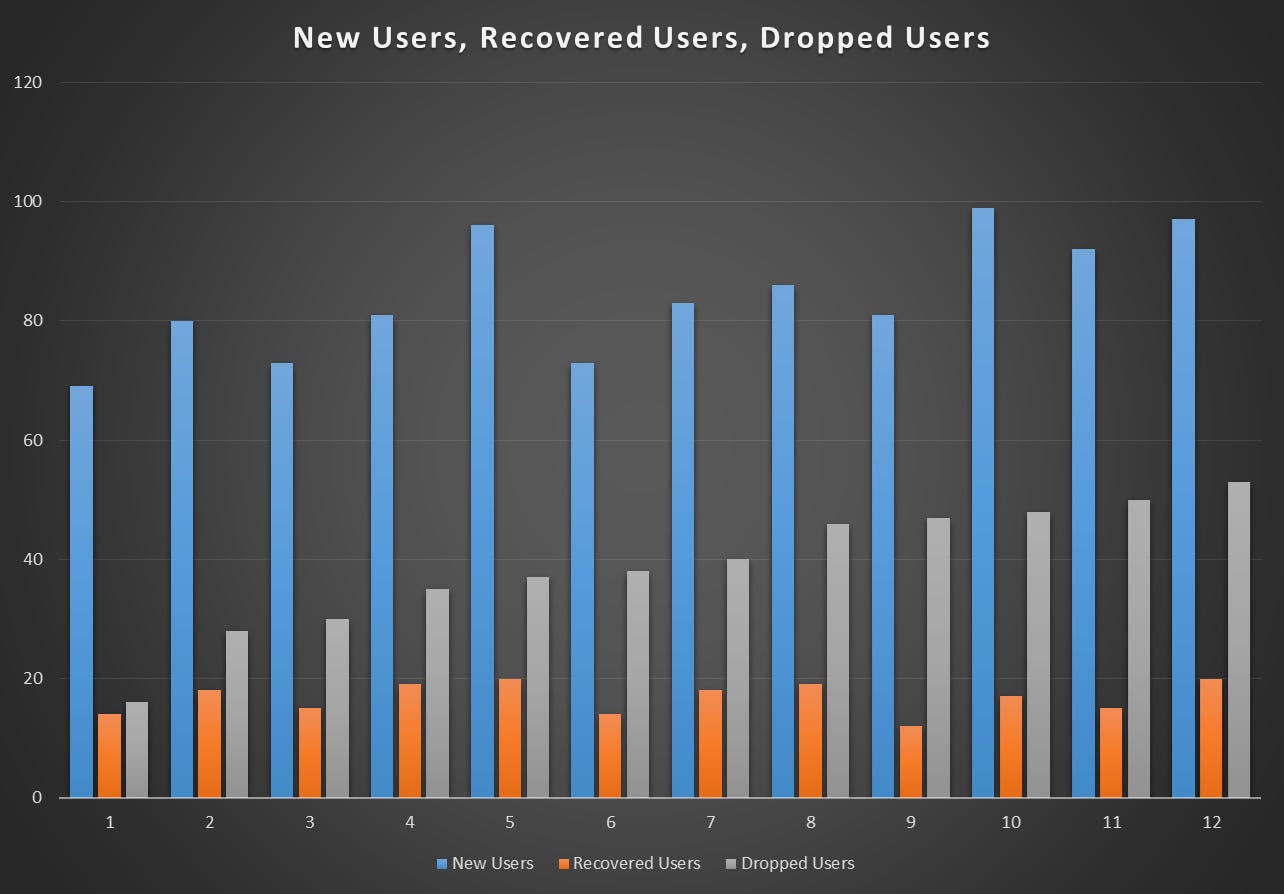
So, it looks like we’re adding new users with a slight uptrend. We’re also dropping users with a slight uptrend as well. Recovered users remains flat over this time period. So now we can see that churn is increasing which is causing our growth to slow. We’re still growing but at a decreasing rate.
Finally let’s take a look at stickiness.

Besides a moderate dip in weeks 3 and 4, we can see our users are coming back to our product at a slightly increasing rate.
Conclusion
The problem with PES should be clear to see; when one of the inputs is several times greater than the other inputs, the PES gets skewed. You can see that happened as the adoption metric skewed PES. If we looked at the PES alone, we also would not have noticed the slowdown in growth.
PES seems more like a product feature that a product analytics company sells you on rather than a good product metric.
With real data, another way I would check how useful PES is as a metric would be to calculate the r2 of the PES with the retention rate. As I mentioned at the top of this post, I view retention as the best metric for product health and product-market fit.
I think it’s too simplistic of a formula to be useful alone. I would rather measure each of these inputs individually. I give credit to the creators of PES for identifying 3 solid metrics that, together but analyzed separately, give a solid view of product health.
I haven't seen PES used much but I like the examples here and am intrigued about it.